Dashboard
Nagare ships an embedded operational dashboard — a single NuGet package mounted as ASP.NET Core middleware, served at /_nagare (configurable). Live event tail, journal browser, time-machine timeline per aggregate, causal map for any event, provenance lens, process inspector, projections, outbox, cluster view.
The aesthetic target is closer to Linear / Stripe than to Hangfire — single accent (electric indigo), Geist Sans + Geist Mono, prose-explained events, dark and light themes.
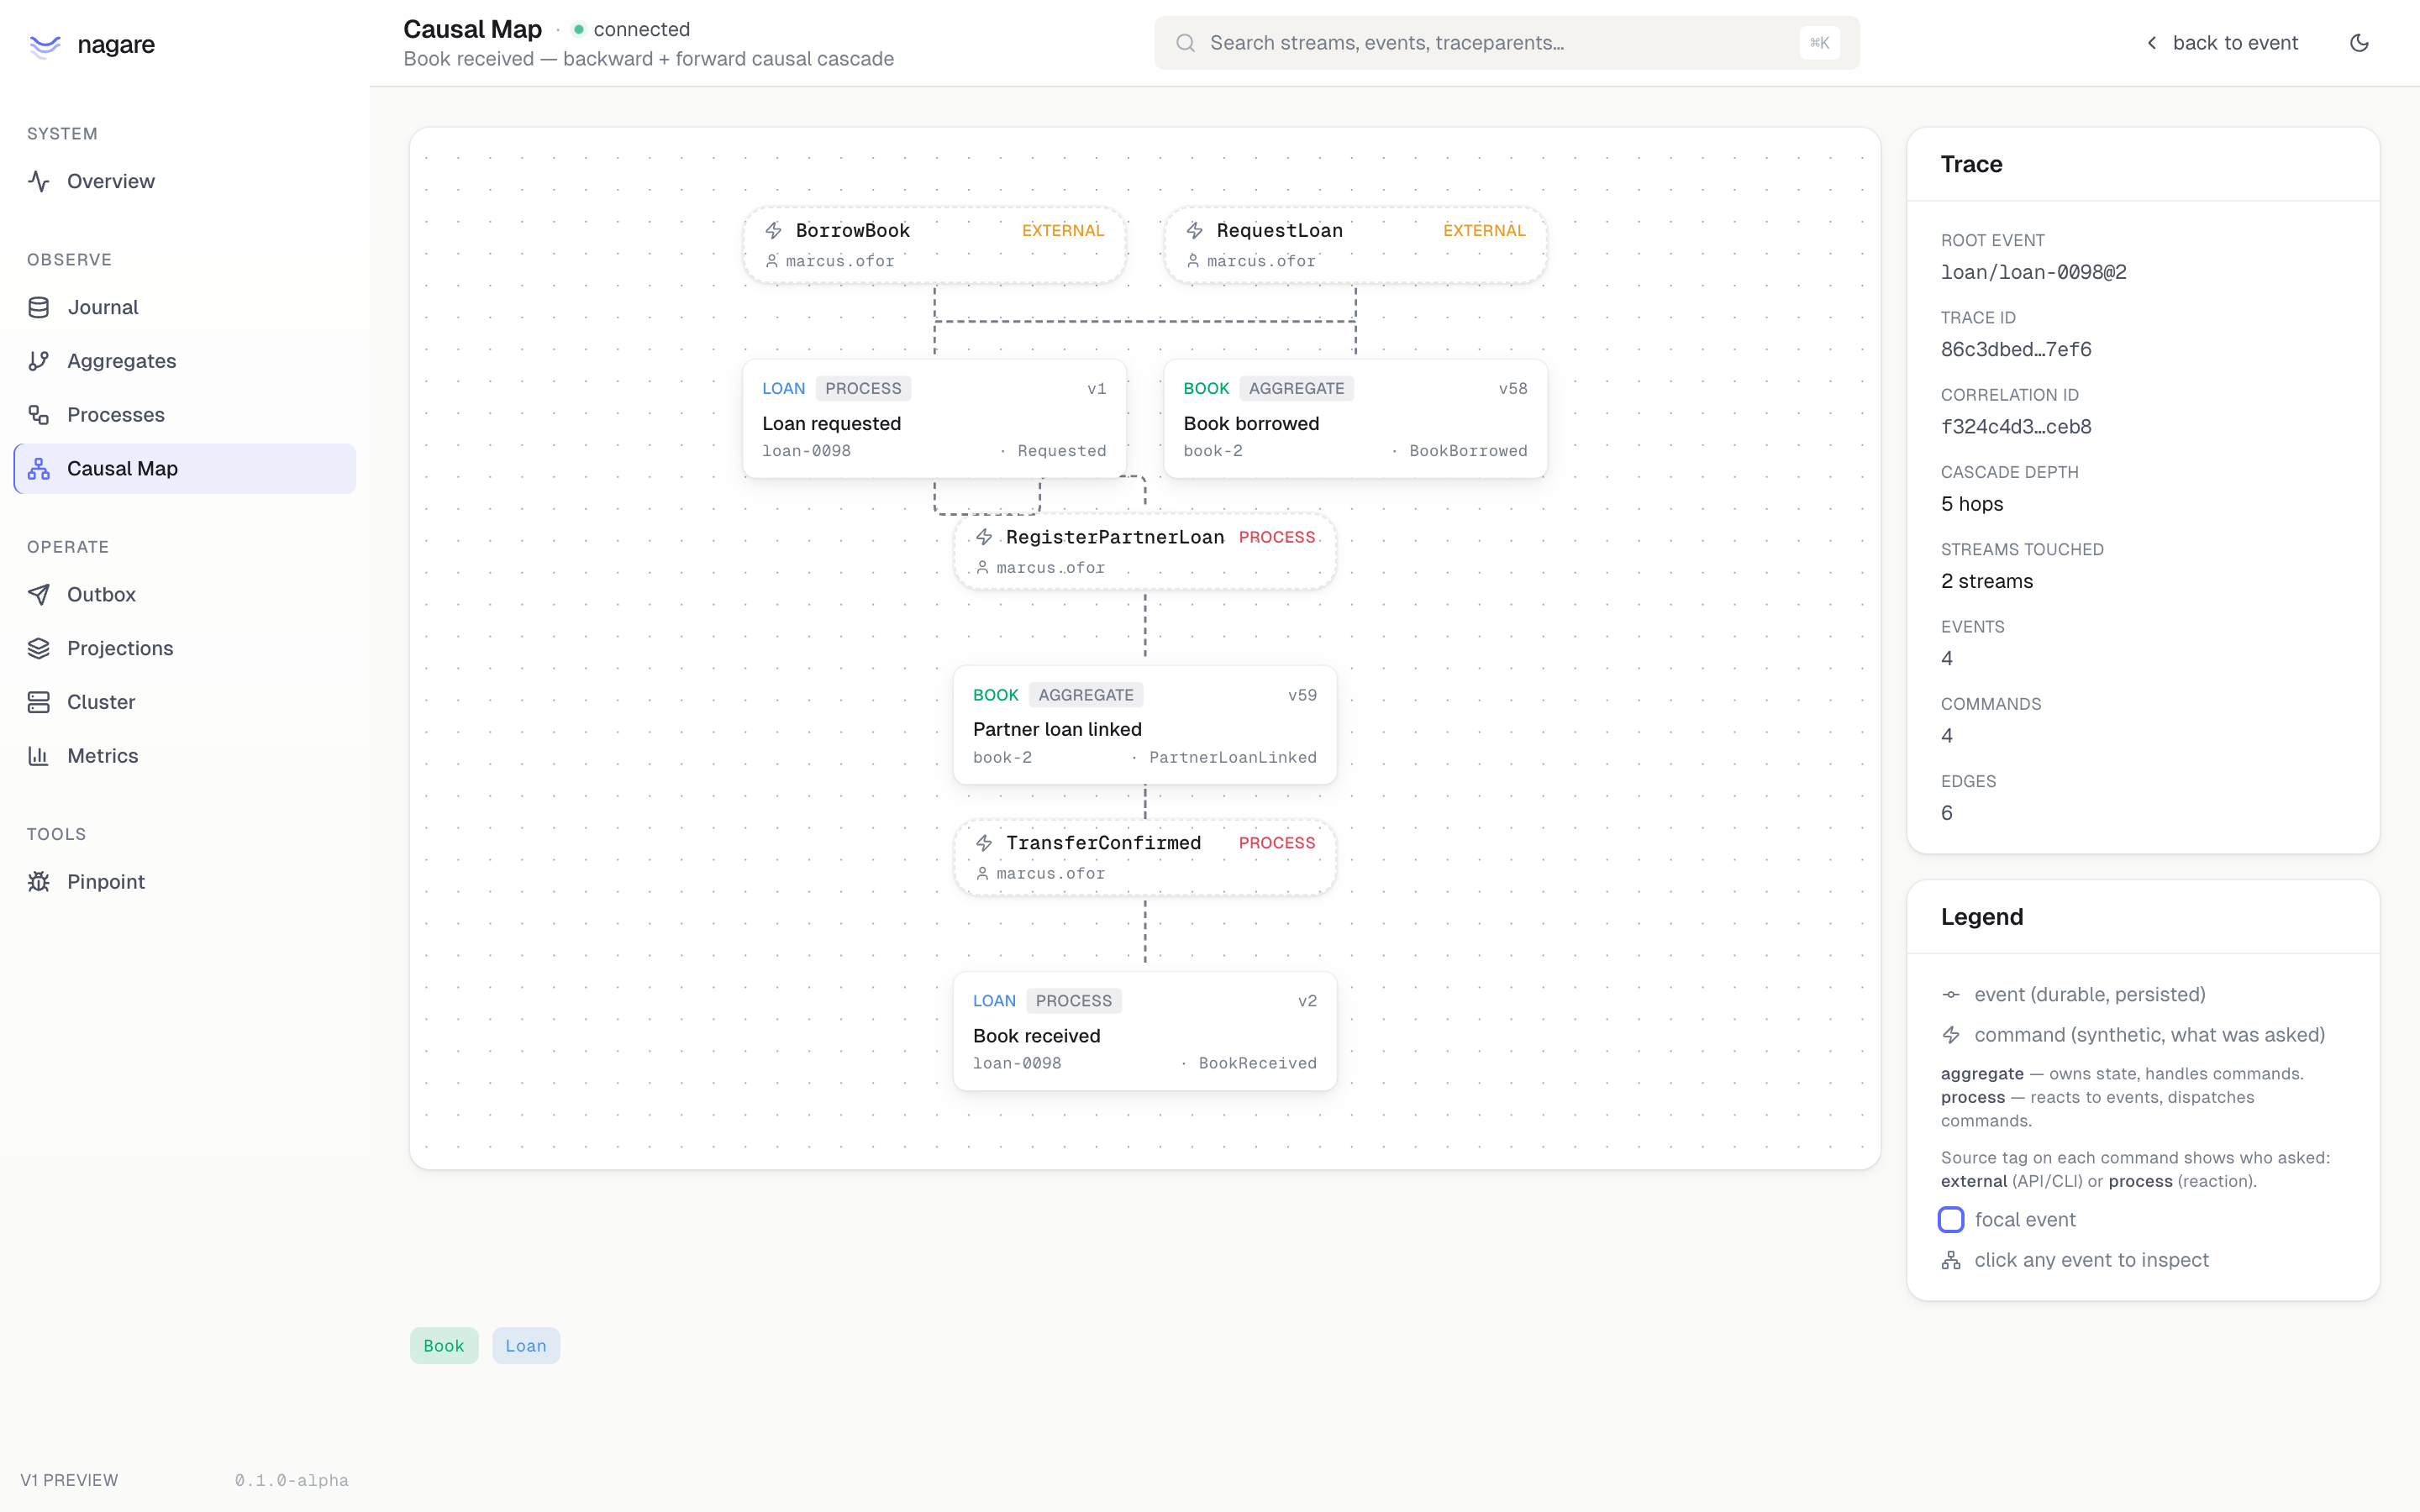
The screenshot above is the Causal Map for an inter-library loan: a RequestLoan from marcus.ofor produced Loan.Requested, the process manager dispatched RegisterPartnerLoan against the Book aggregate, and the resulting PartnerLoanLinked event triggered TransferConfirmed back into the loan process. Five hops, two streams, one originating actor — all reconstructed from event metadata, no separate audit store.
Install
dotnet add package Nagare.DashboardMount
using Nagare.Dashboard;

builder.Services.AddNagare();
builder.Services.AddSqliteEventStore<BookEvent>("BookEvents");
// …other Nagare registrations…

builder.Services.AddNagareDashboard();
builder.Services.UseLocalDevAuthorization(); // dev only — see below

var app = builder.Build();
app.MapNagareDashboard();   // mounts at /_nagare
By default the SPA lives at /_nagare. Pick a different prefix with app.MapNagareDashboard("/admin/nagare").
Authorization is required
The dashboard reads the entire event journal — every command, every event, every dispatch. It is fail-closed by default. Without an explicit INagareDashboardAuthorizationFilter the dashboard returns 403 to every API request and shows an "access denied" screen.
Three preset filters ship with the package:
| Filter | Use for | Capability granted |
|---|---|---|
NagareLocalDevFilter | local dev (dotnet watch) | All for loopback requests |
NagareReadOnlyFilter | shared environments | Browse for any authenticated user |
NagareCapabilityFilter | production | declarative, claim/role-driven |
For local dev:
builder.Services.AddNagareDashboard();
builder.Services.UseLocalDevAuthorization();
For production, write a filter that maps your auth scheme to capabilities:
builder.Services.AddNagareDashboard(opts =>
{
    opts.AuthorizationFilter = new NagareCapabilityFilter()
        .RequireAuthenticated()
        .GrantToAll(NagareDashboardCapabilities.Browse)
        .GrantToRole("ops",  NagareDashboardCapabilities.ReplayDispatch | NagareDashboardCapabilities.ResetCheckpoint)
        .GrantToClaim("scope", "nagare:admin", NagareDashboardCapabilities.All);
});
Capabilities
[Flags]
public enum NagareDashboardCapabilities
{
    None             = 0,
    Browse           = 1 << 0, // read events, aggregates, processes, projections, outbox
    ReplayDispatch   = 1 << 1, // requeue a dead-letter row
    ResetCheckpoint  = 1 << 2, // rewind a projection to start
    Bisect           = 1 << 3, // run a bisect invariant
    All              = ~0,
}
The SPA fetches /capabilities on load and gates every action button on the response. Endpoints reject requests for capabilities the caller does not hold.
Causal Map and command attribution
The Causal Map is the page that justifies the dashboard. Open any event and you get the full backward + forward causation tree — every event the focal event caused, and every event that caused the focal event — annotated with the commands that drove each transition.
Command nodes are synthesised from EventMetadata:
| Field | Where it comes from |
|---|---|
CommandType | Auto-populated by Aggregate.Ask from command.GetType().Name |
CommandSource | External for direct calls, Process for ProcessGrain dispatches; producer-overridable to Scheduler, System, Replay |
ActorId | Producer-supplied — usually pinned by middleware from HttpContext.User. Pairs with CommandSource. |
Headers | Free-form IReadOnlyDictionary<string, string> for tenant id, branch, feature-flag bucket — anything you want surfaced in dashboards but don't want as a first-class field. |
CorrelationId | Threaded from the producer; the Causal Map joins the tree by this. |
TraceParent | W3C trace context, auto-captured at append time when an Activity is in scope. |
You don't have to do anything to get CommandType and CommandSource — they fill in automatically. To get ActorId and Headers on every event, attach metadata once in a command middleware:
public sealed class HttpContextCommandMiddleware(IHttpContextAccessor http) : ICommandMiddleware
{
    public Task<IReply> InvokeAsync(AskContext context, AskDelegate next)
    {
        var ctx = http.HttpContext;
        if (ctx is null) return next(context);

        var enriched = context with
        {
            Metadata = (context.Metadata as EventMetadata ?? EventMetadata.Empty) with
            {
                ActorId = ctx.User.FindFirstValue(ClaimTypes.NameIdentifier),
                CorrelationId = ctx.TraceIdentifier,
                Headers = new Dictionary<string, string>
                {
                    ["tenant"] = ctx.User.FindFirstValue("tenant_id") ?? "",
                },
            }
        };
        return next(enriched);
    }
}
After that every event the command produces — and every event downstream process managers produce in reaction — carries the same actor and tenant. ProcessGrain propagates both fields through dispatch automatically.
The full audit recipe (including writing the audit row downstream) is in Command audit.
Pages
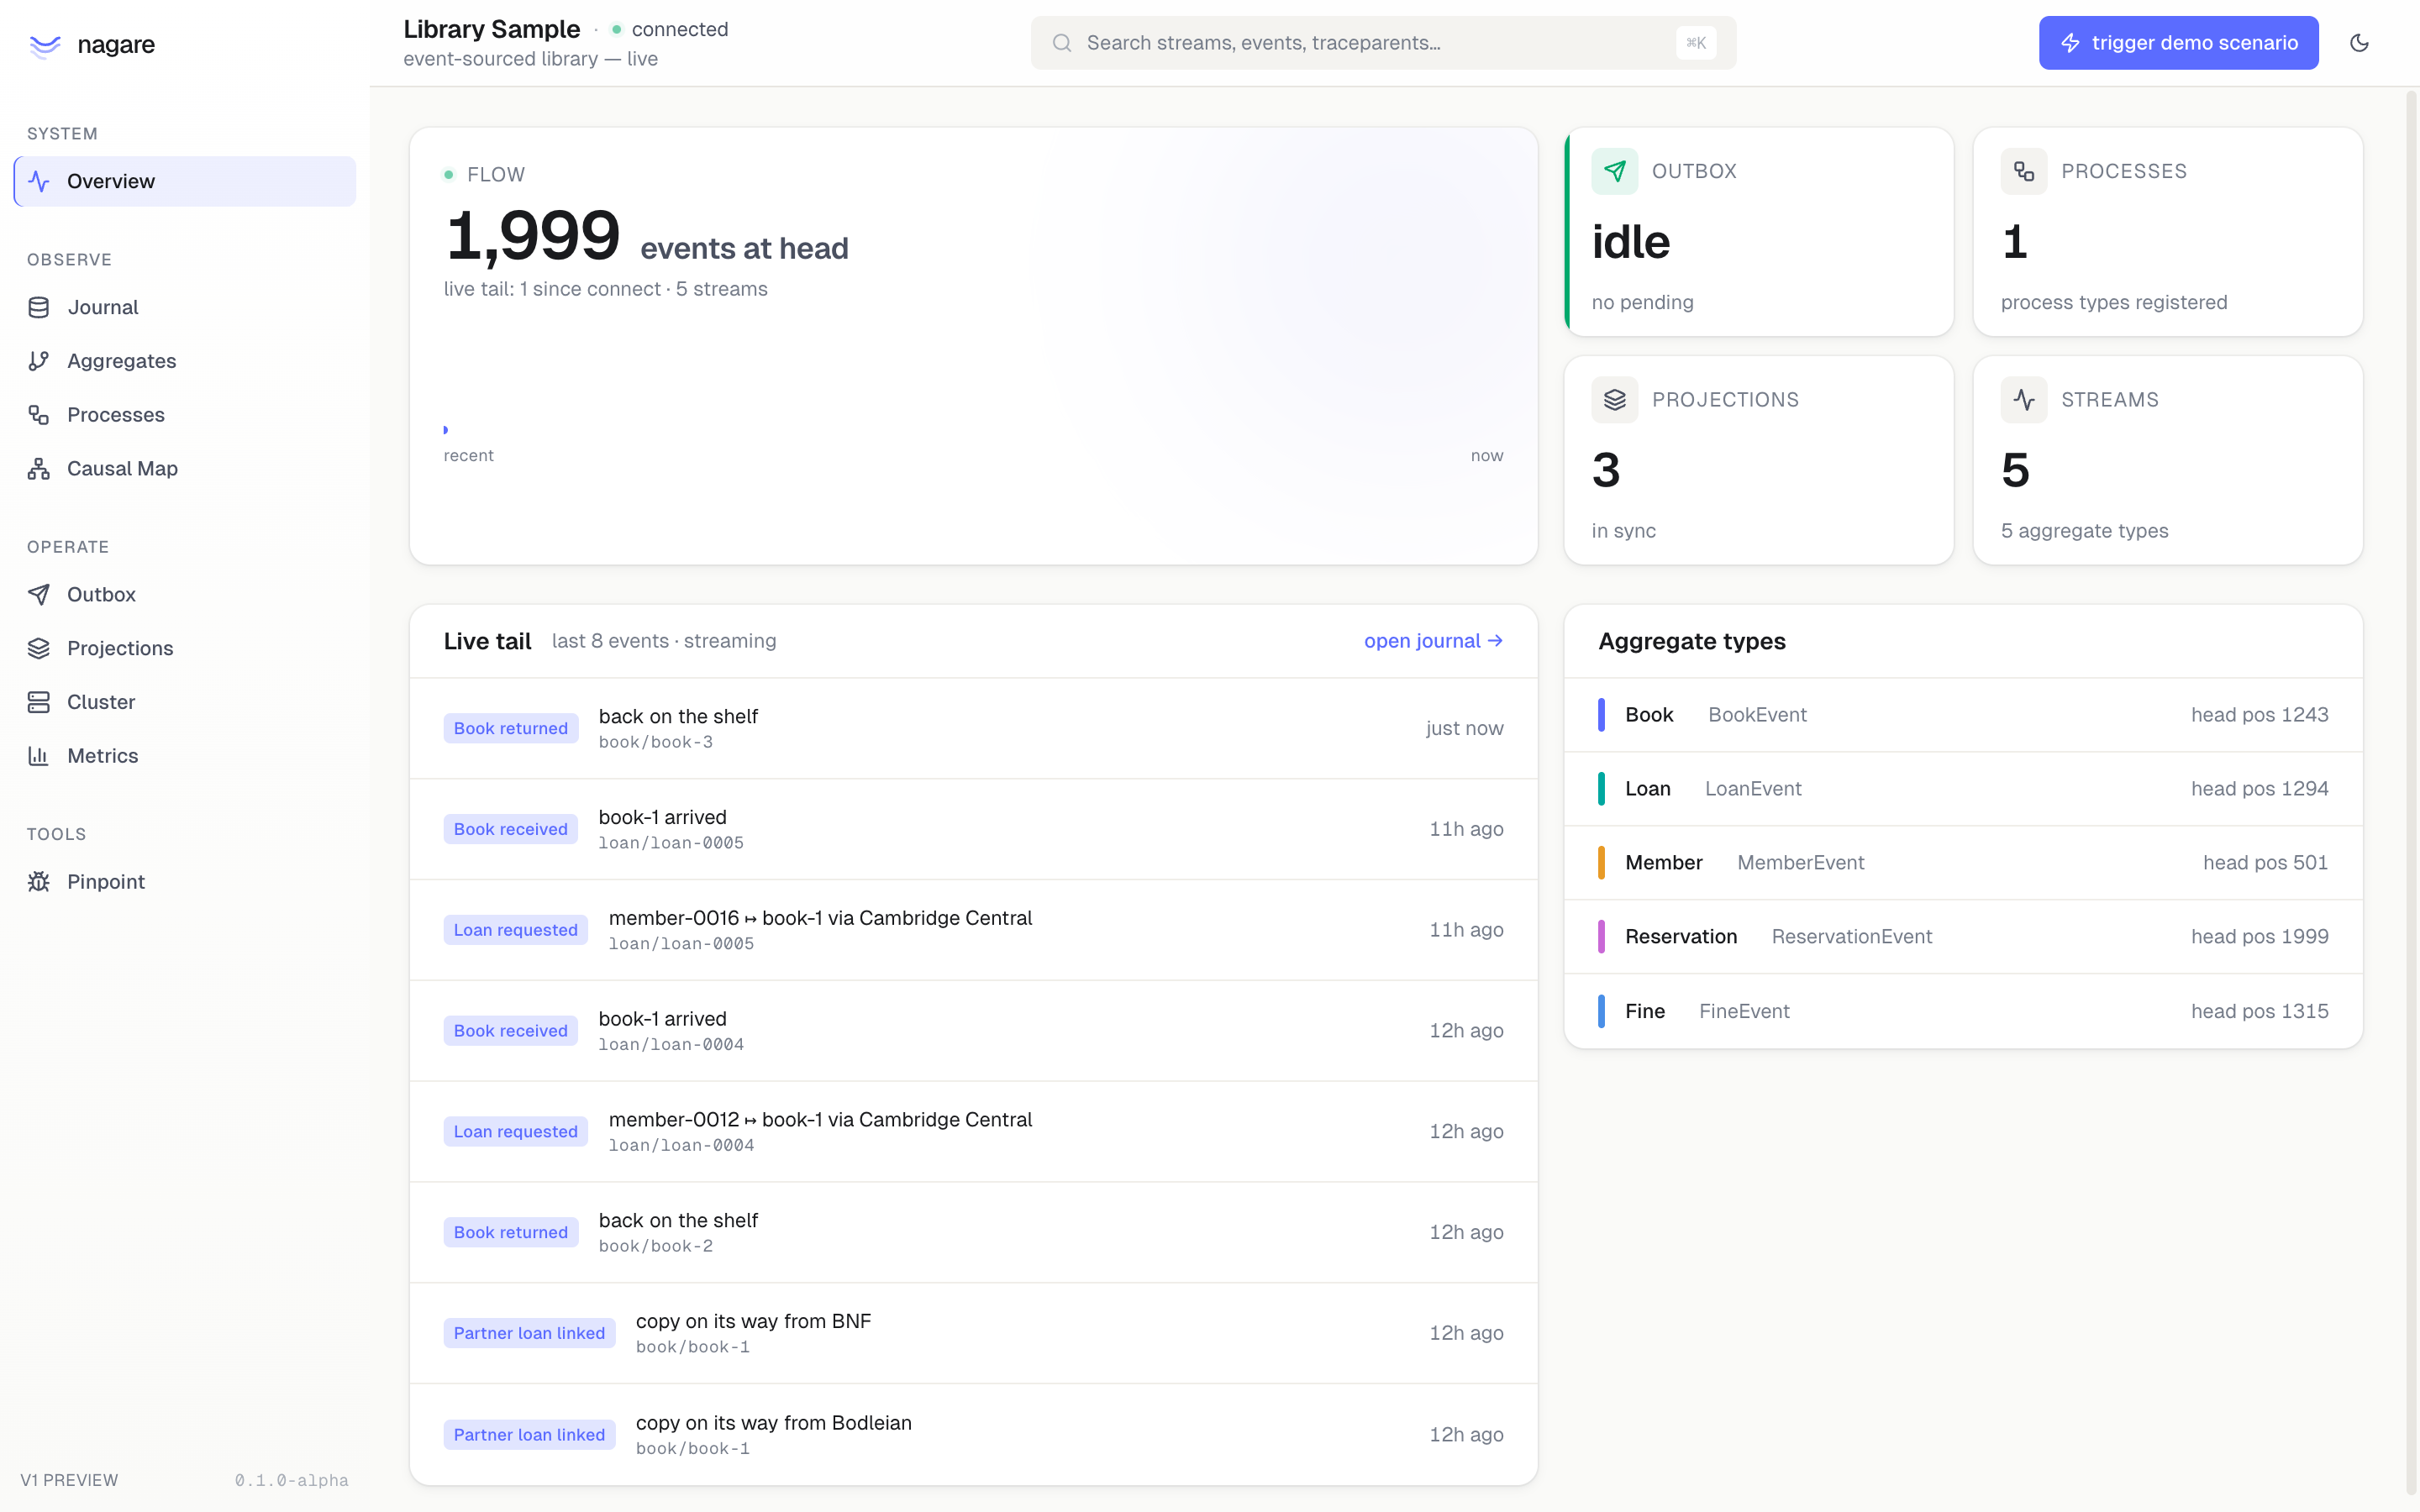
Overview
Journal head, per-stream positions, outbox lag and dead count, projection health, live event tail.
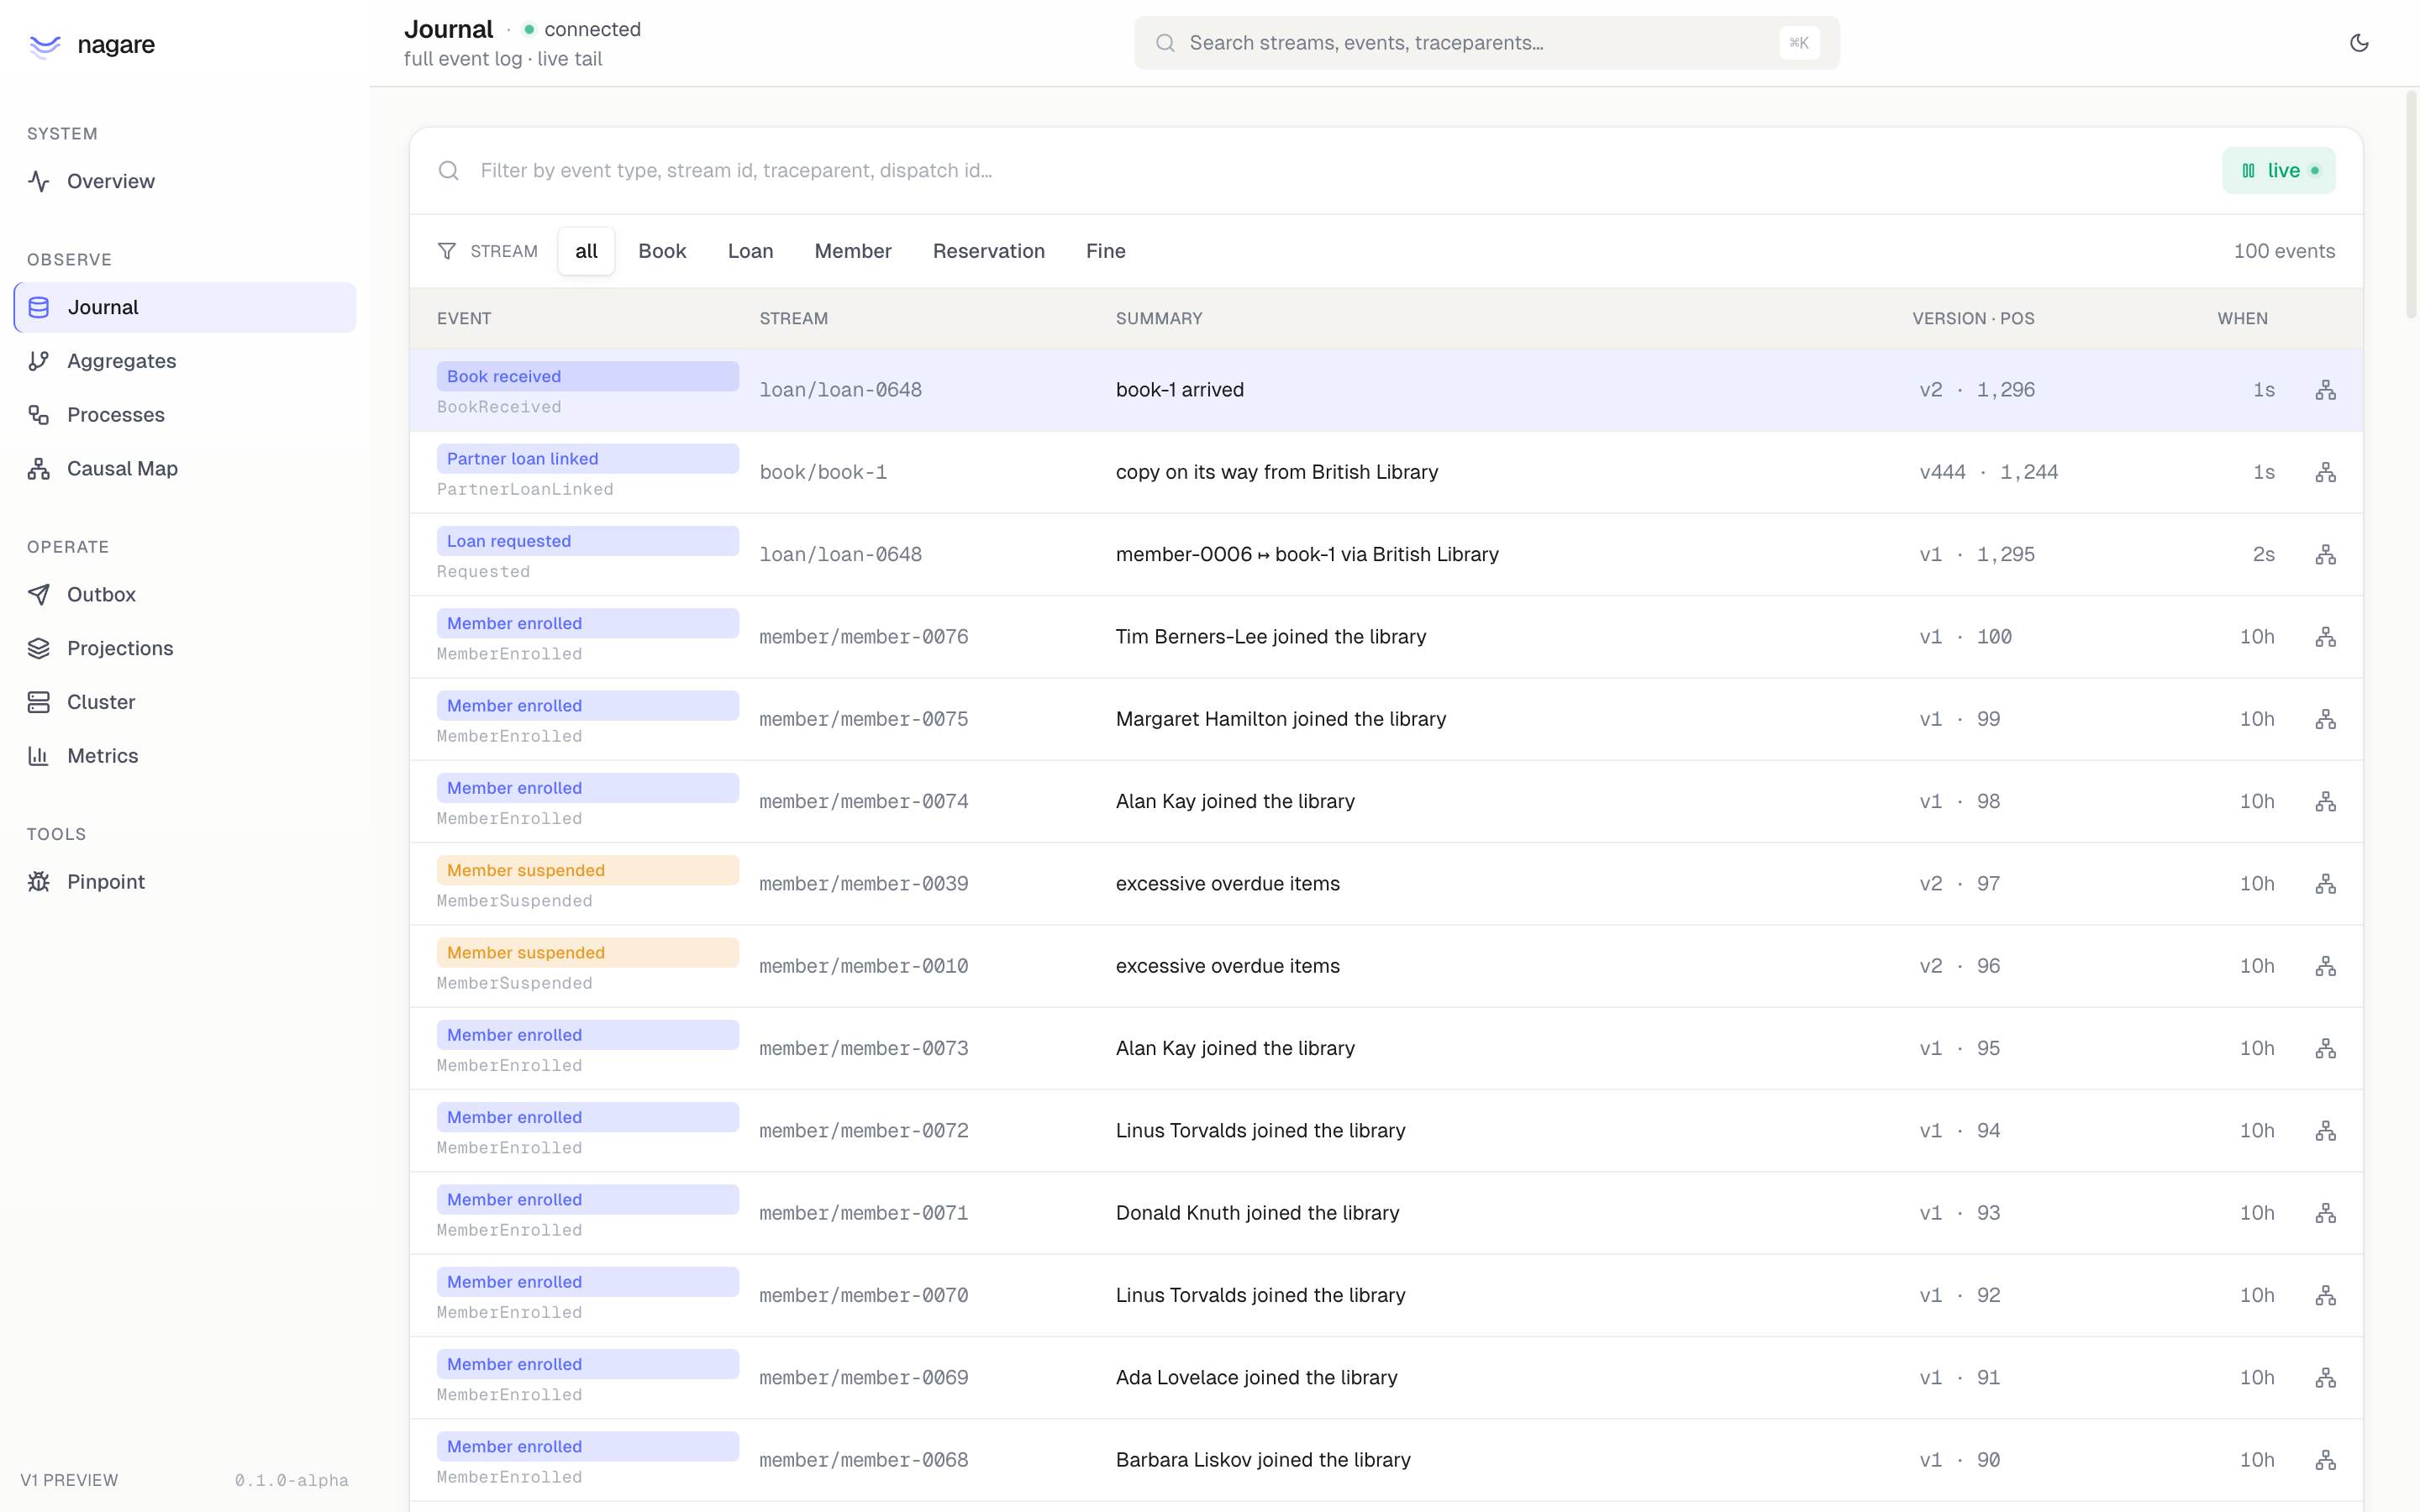
Journal
Paged event read with prose explanations, plus SSE live tail. Each row links to its Causal Map and Provenance Lens. Filter by stream type, search by traceparent or stream id.
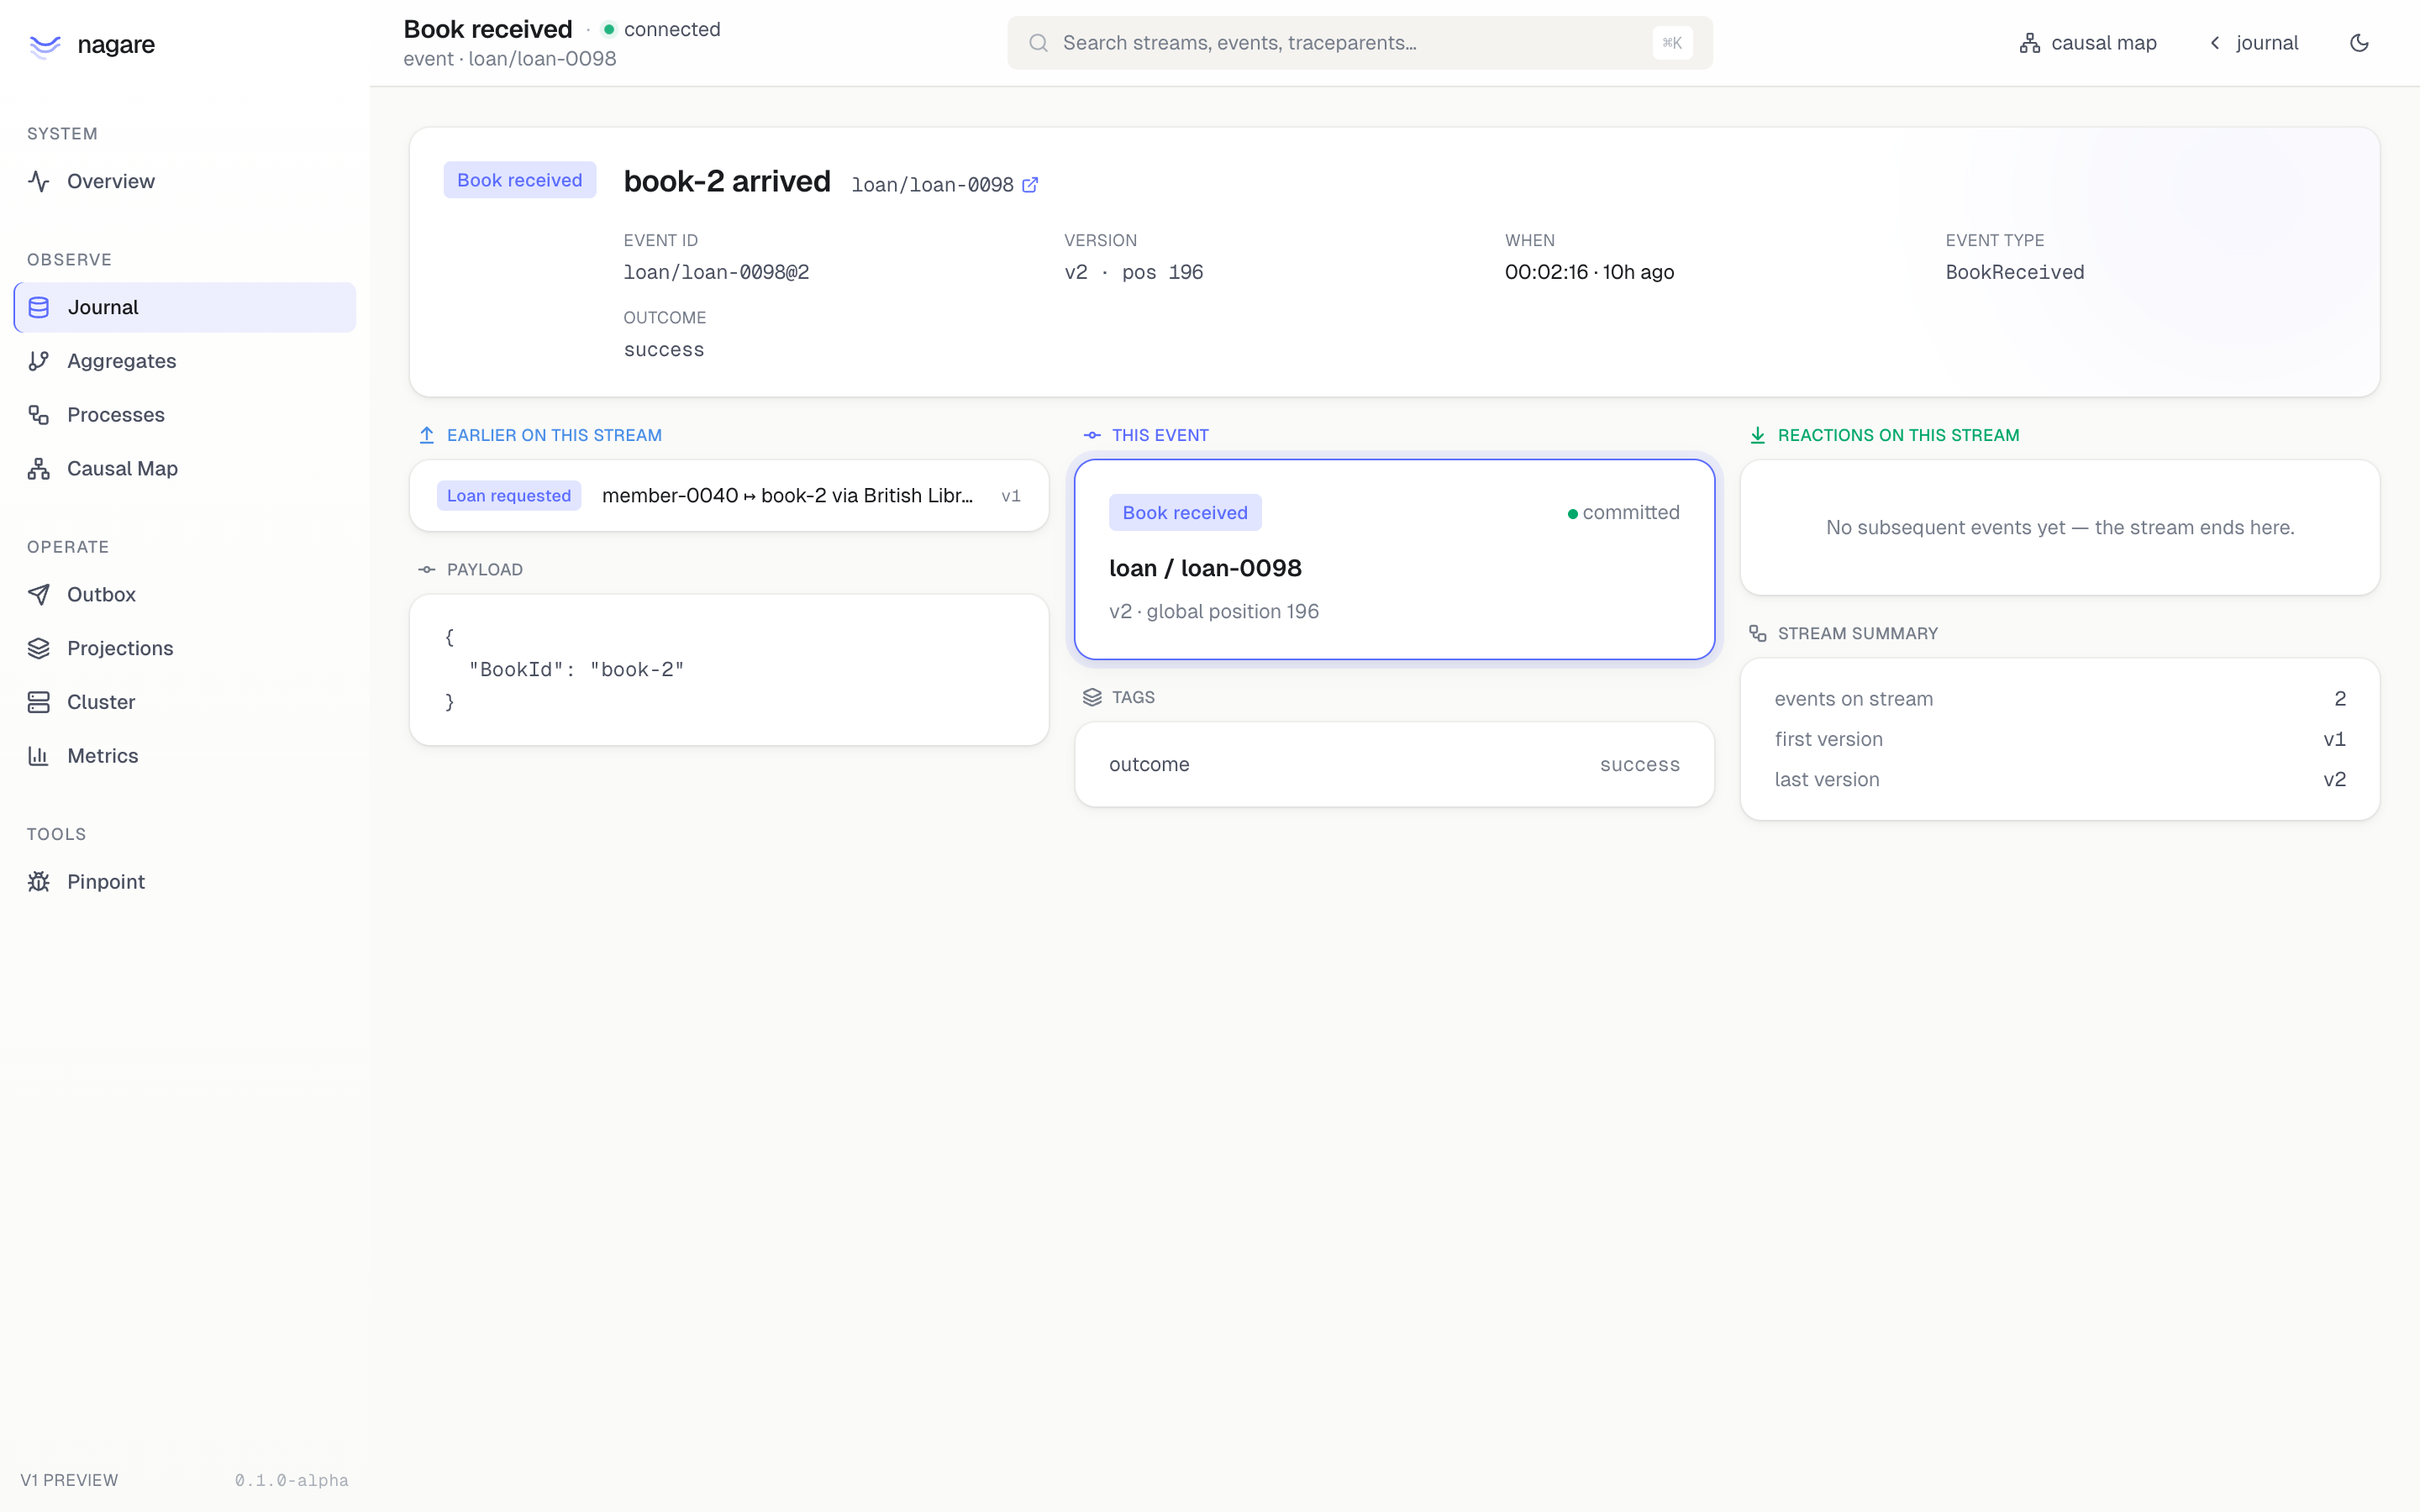
Provenance Lens
One event in stream context — explanation, payload, full metadata (correlation, trace, actor, headers), neighbouring events. The deep-link target for "what happened on this stream around this event."
Streams
Registered subscriptions and live taps with checkpoint position, lag from journal head, last error, recent throughput, and a role chip (projection / reactor) when the pipeline was tagged via AddRowInspector or AddStreamRole. Reset and "set position" actions are gated on the ResetCheckpoint capability.
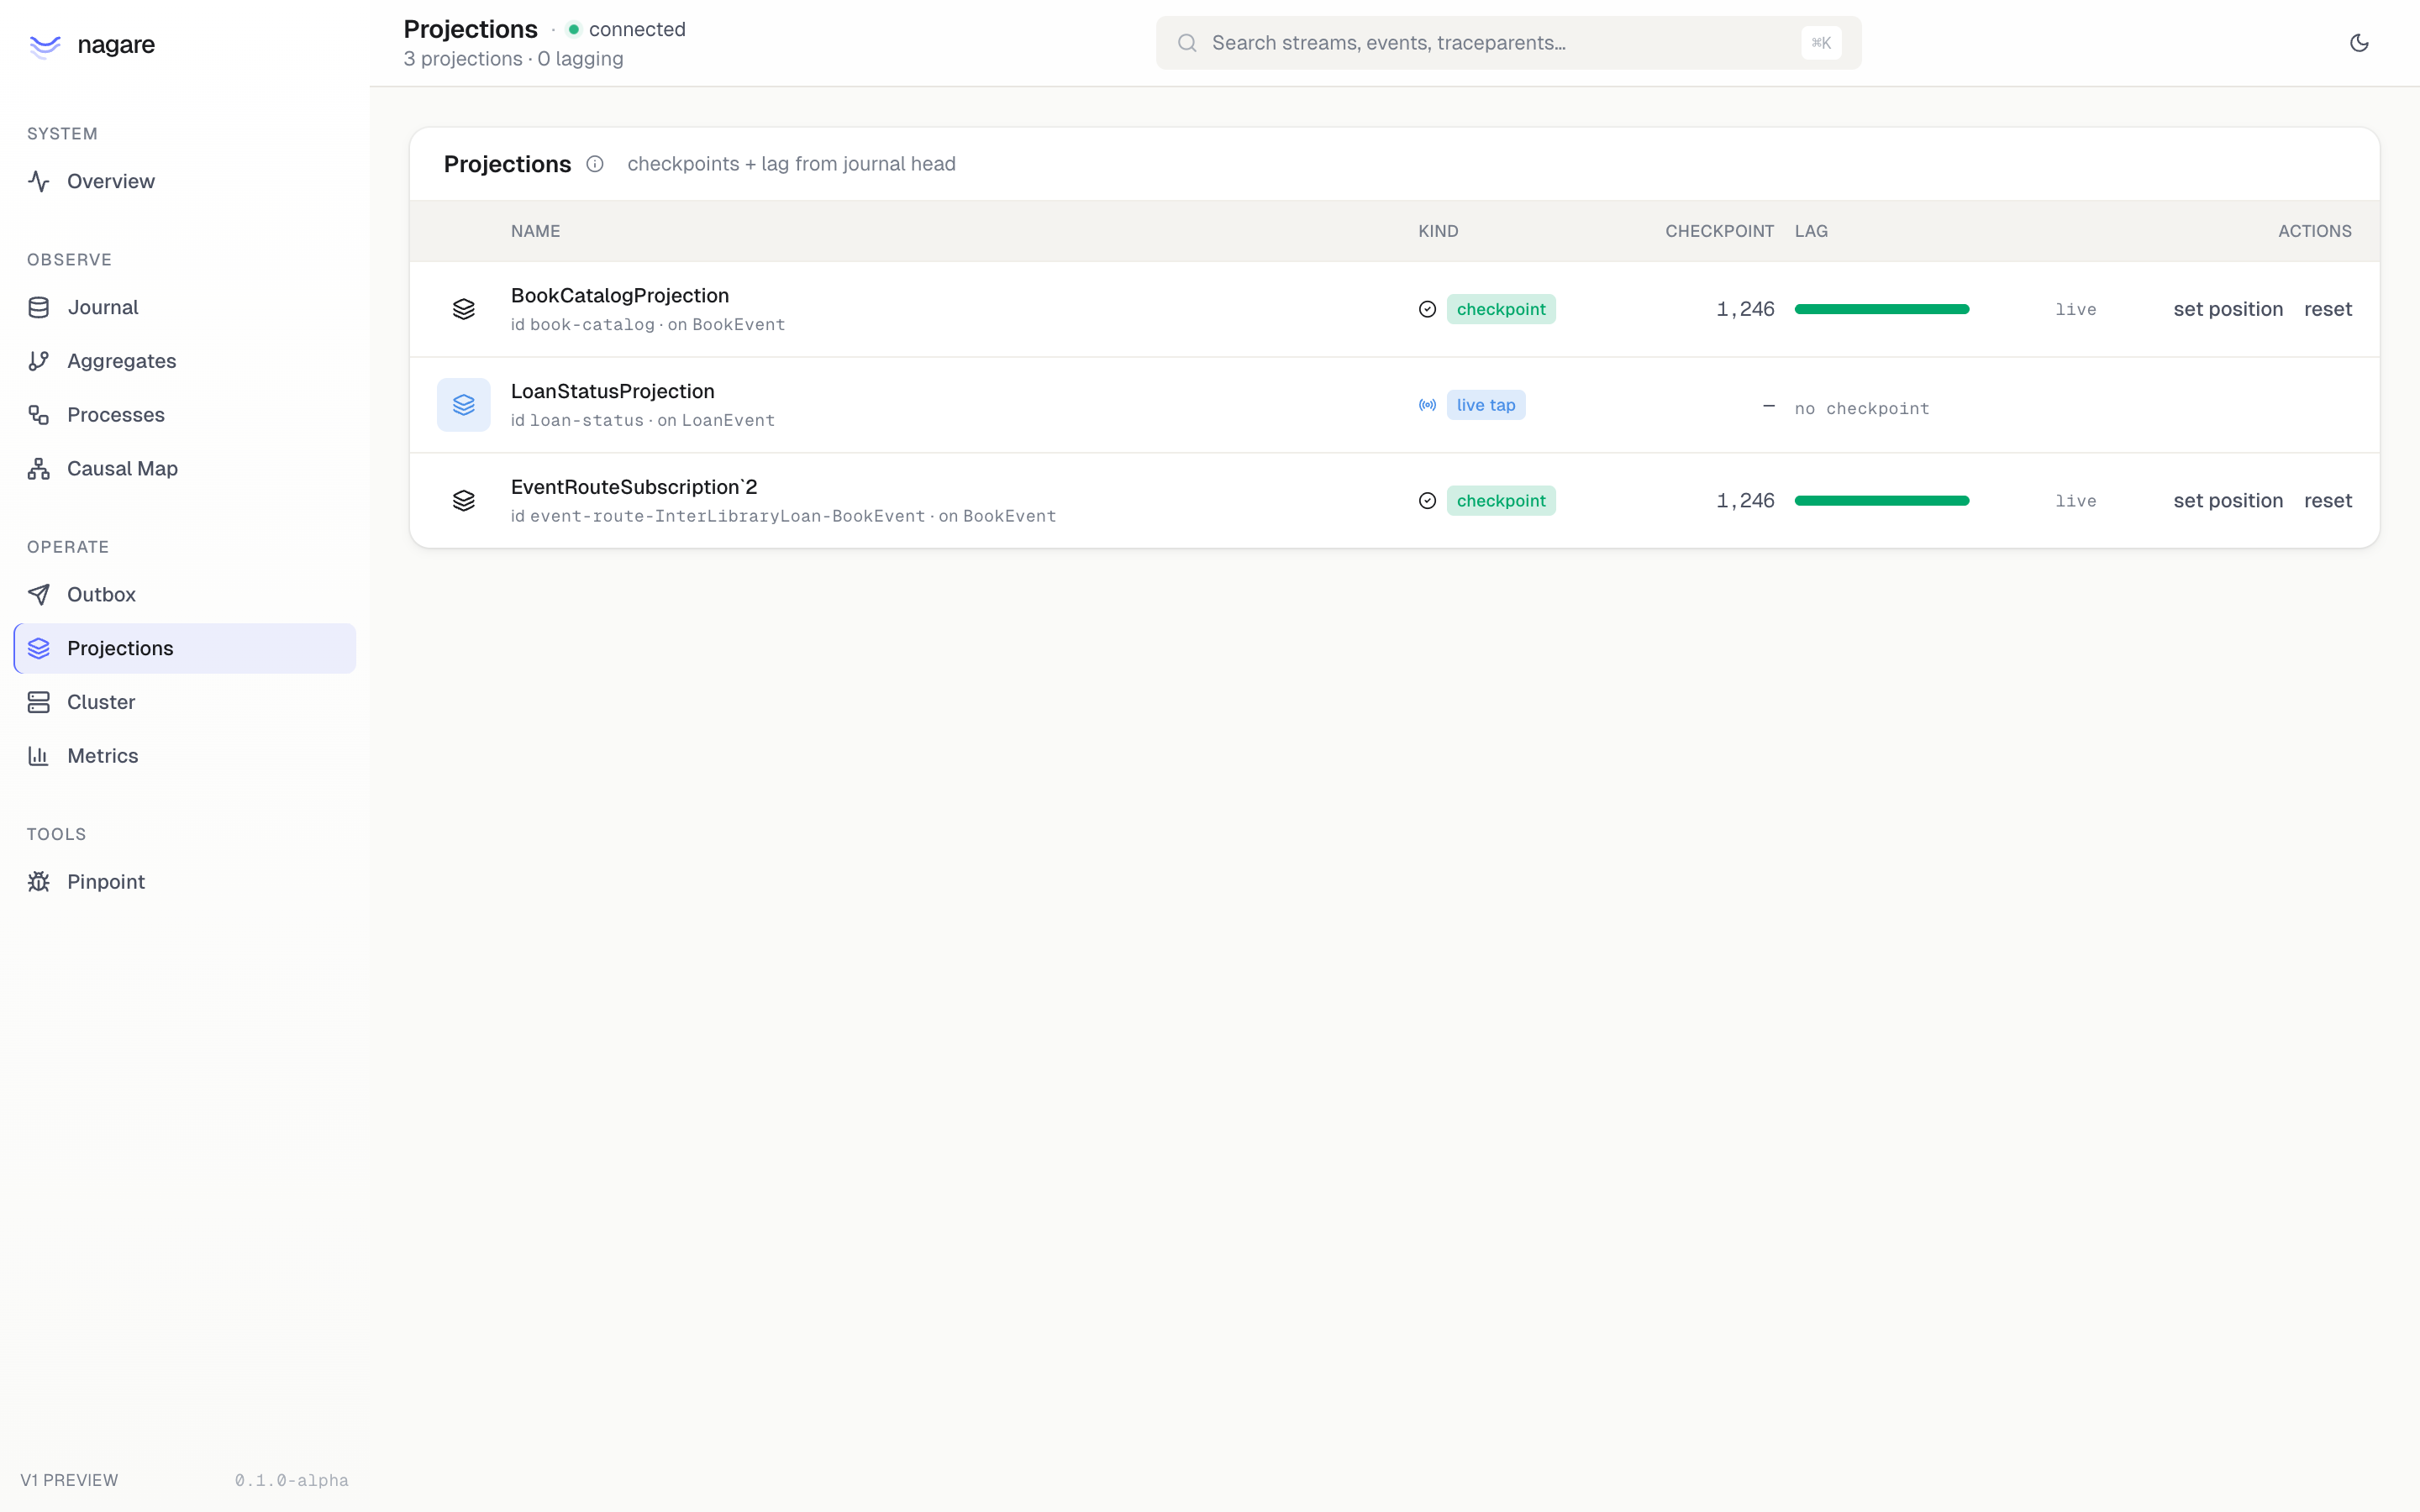
Per-stream detail (/_nagare/streams/{id}) renders the operator pipeline diagram, error/fatal history, and a rows panel when the pipeline registered a row inspector — see Row inspector below.
Pollers
Non-journal pipelines (HTTP cursors, retry queues, anything backed by IOffsetStore<T> with an offset type other than Position). Shows the live offset value (JSON), throughput sparkline, p95 latency, and gated reset / edit cursor actions. The edit dialog deserialises the JSON server-side and rejects offsets that don't match the registered offset type.
Row inspector
Projections that own a read-model table can opt into a row browser via AddRowInspector(...) in startup. Once registered, the per-stream detail page renders a tight table with the whitelisted columns, filter chips for the columns you nominated as filterable, a 25/50/100/200 row limit selector, and a ↗ events link per row that jumps to the source aggregate's time machine — the one thing pgAdmin/Postico can't do because they don't know the projection ↔ stream mapping.
builder.Services.AddRowInspector(
    pipelineId: BookCatalogProjection.Identifier.Value,
    tableName: "book_catalog",
    aggregateIdColumn: "id",
    streamType: "Book",     // aggregate name, not event name — used in /aggregates/{type}/{id}
    columns: ["id", "title", "author", "isbn", "is_borrowed"],
    filterableColumns: ["author", "is_borrowed"]);
Identifiers are validated at registration (letters/digits/underscore only) and quoted server-side. Filters not in filterableColumns are silently ignored — saved URLs survive column-list changes. The endpoint enforces a hard LIMIT 200 regardless of ?limit=.
Calling AddRowInspector implicitly tags the pipeline as StreamRole.Projection. Use services.AddStreamRole(pipelineId, StreamRole.Reactor) to tag reactors (event routers, command dispatchers); the registration in AddProcess<…>().DispatchesTo<…>() auto-tags its event-route pipelines as Reactor for you.
Storage support: Postgres, SQLite, MySQL, and SQL Server. The dashboard resolves an IRowInspectorDialect from DI (auto-registered by AddPostgresJsonOffsetStores / AddSqliteJsonOffsetStores / AddMySqlJsonOffsetStores / AddSqlServerJsonOffsetStores); split-DB topologies can override by registering a different dialect explicitly.
Other pages
| Page | What it shows |
|---|---|
| Aggregates | Discovered event types, event store table, recent activity per stream |
| Time Machine | Event timeline per aggregate stream with a scrubber, raw payload at cursor, and the typed aggregate state folded server-side at that version (with a diff vs the previous step) |
| Messages | Inbound message-channel subscriptions and outbound producers — per-partition offsets, lag, throughput |
| Processes | Registered process types (those derived from Process<,,>) |
| Process Inspector | Event timeline for a specific process instance |
| Outbox | Pending sample, dead-letter sample, gated replay action per dispatch. Per-process counters. |
| Cluster | Local node details (machine, PID, uptime), runner status, lease holders for distributed locks |
| Metrics | Tiered rolling buckets per subscription (handled, failed, p50/p95 latency) |
| Pinpoint (preview) | Bisect invariants — run an invariant function across history to find the event that broke it |
Endpoint surface
All under /<prefix>/api/. Browse capability required unless noted; (open) means callable when the filter returns None.
GET  /capabilities                          (open)
GET  /overview
GET  /events?fromPosition=&take=&streamType=
GET  /events/live                           (SSE)
GET  /events/{streamType}/{streamId}@{version}
GET  /aggregates
GET  /aggregates/{type}/{id}/events?fromVersion=&take=
GET  /aggregates/{type}/{id}/state?version=
GET  /processes
GET  /processes/{type}/{id}
GET  /projections
GET  /projections/{name}/detail
POST /projections/{name}/reset              (ResetCheckpoint)
POST /projections/{name}/checkpoint         (ResetCheckpoint)
GET  /streams/{name}
GET  /streams/{name}/rows?<filter>=&limit=
GET  /streams/{name}/replay                 (SSE)
GET  /messages
GET  /messages/{name}
GET  /pollers
GET  /pollers/{id}
POST /pollers/{id}/reset                    (ResetCheckpoint)
PUT  /pollers/{id}/offset                   (ResetCheckpoint)
GET  /outbox
POST /outbox/{dispatchId}/replay            (ReplayDispatch)
GET  /causal/{streamType}/{streamId}@{version}
GET  /cluster
GET  /metrics
GET  /bisect/invariants
POST /bisect/{name}                         (Bisect)
GET  /health
Prose-explained events
The single piece that separates Nagare's dashboard from grep over the journal is IEventExplainer<TEvent> — an optional, per-event-type contract that turns a raw event into a sentence. See Event explainers for the full pattern.
When no explainer is registered for an event type, a generic key=value summary is rendered. Registering even a one-method explainer for the events your team reads most often turns the journal from log soup into a coherent story.
SPA build pipeline
The package embeds the prebuilt SPA as EmbeddedResource and serves it via ManifestEmbeddedFileProvider. Consumers don't need Node.js at runtime. To rebuild the SPA against new tokens or new pages, see src/Nagare.Dashboard/ui/ in the Nagare repo.
Internals visibility
The dashboard package uses [InternalsVisibleTo("Nagare.Dashboard")] on Nagare core to read state that's intentionally not public — AppliedDispatchTracker, projection checkpoints, outbox lease state. This is first-party tooling; the coupling is acceptable. If you build a third-party dashboard, prefer the public API and file an issue for any read shape you need.
Limits in v1
- Time Machine state fold requires
AddAggregate<…>()(orAddProcess<…>()) on the host. The dashboard pulls the typed state at a version by re-running the aggregate's event handlers, registered as anIAggregateFolderat registration time. If a stream type was never registered through those helpers, the state card shows a one-line hint and only the raw payload is rendered — the timeline and event payload still work. - Pinpoint (Bisect) ships invariant scaffolding but the sandboxed replay runner is still maturing — treat results as advisory until the runner is hardened.
- PII on the wire.
ActorIdandHeadersare stored verbatim and rendered in the dashboard. If your actor ids are emails or your headers carry GDPR-scoped data, gateBrowsemore tightly than you would for a stack-trace viewer.
See also
- Command audit — the metadata story end-to-end: how to pin actor + headers from
HttpContextand write the audit row downstream - Event explainers — turning typed events into prose for the journal
- Observability — what each metadata field is for and how trace context threads through subscriptions
- Transactional outbox — the model behind the Outbox page